Although on a day-to-day basis when I’m providing my content writing and content marketing services I don’t deal with much with visual content (images and videos), these days, I do provide images and basic video to a few clients because I am handling their social media marketing.
Visual content – images, photographs, animation, infographics and video – is a big part of content marketing these days.
This is because multimedia content is easier to access these days due to abundant connectivity and speedier connections. People are no longer worried when they have to download media files. Anyway, that’s different issue.
Here is an infographic on how businesses are using visual content for content marketing and what impact it has on their overall marketing strategy. The infographic is from this blog post on Social Media Today. (I was having some trouble uploading the entire infotographic file so I have divided it into different files).
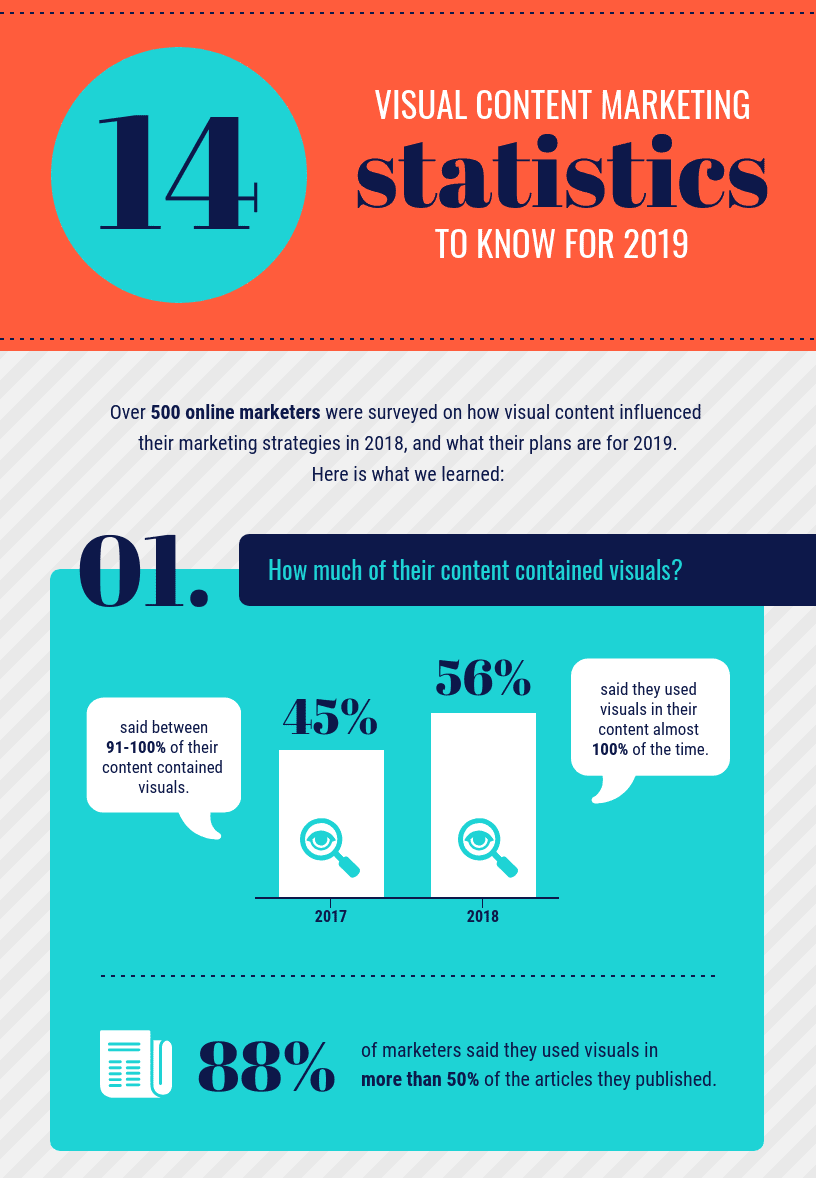
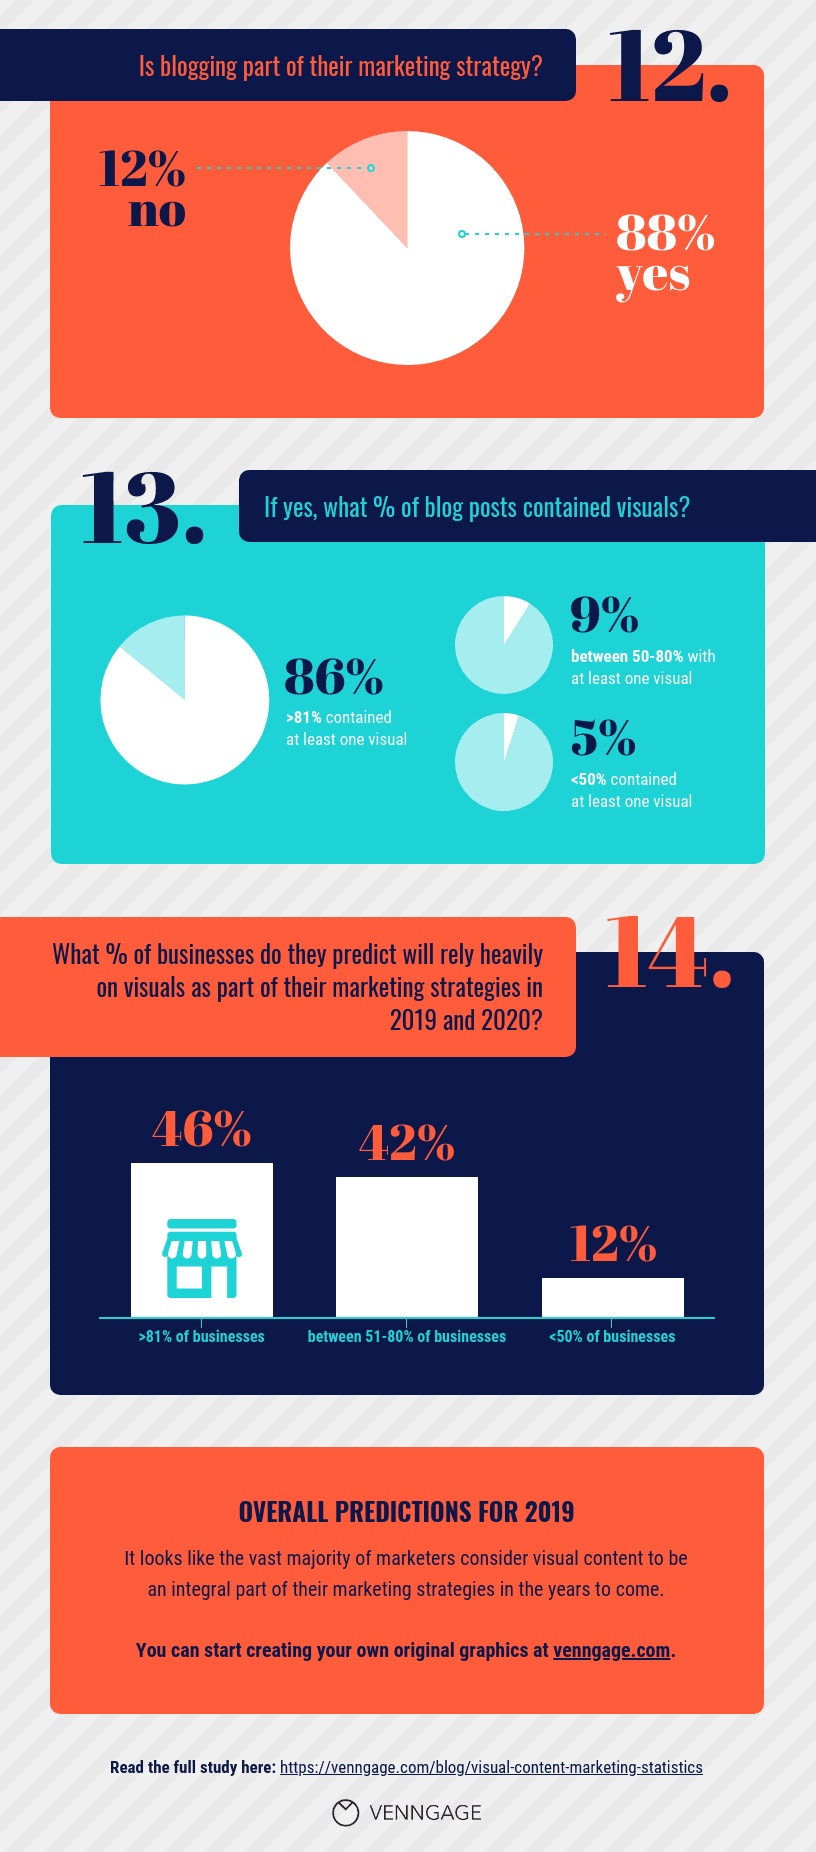
As you can see in the infographic, according to the first stat, 91-100% content contained visual content.
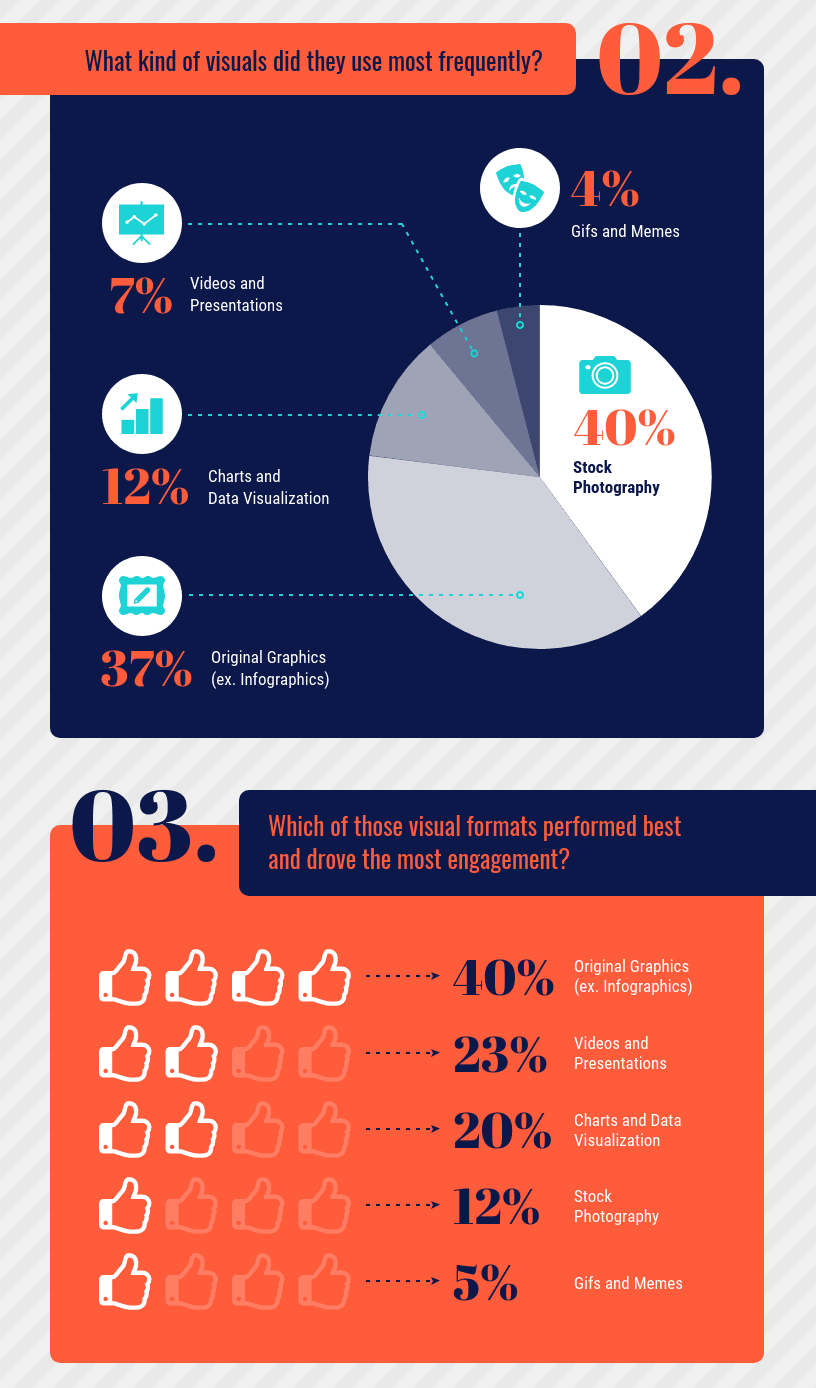
7% marketers use videos and presentations and 37% use original graphics such as infographics. Original graphics drove the most engagement, which is understandable because with videos, often it becomes difficult to engage.